The Ultimate 44 Used Graphics Card Pricing & Benchmark Guide
Along with our recent editorials on why it's a bad time to build a gaming PC (not least because of overpriced GPUs) we've been revisiting some older graphics cards to see how they hold up in today's games for those of you who have been eyeing the secondhand market. After retesting a series of older cards in recent months, we've been happy to learn that the GTX 680, R9 280X and even the GTX 760 still perform quite well in the latest games using medium quality settings at 1080p.
As a quick reminder, the GTX 680 and R9 280X were comparable to the GTX 1050 Ti in terms of performance but at today's prices they can be found for around the cost of a GTX 1050 or RX 560. Meanwhile, the GTX 760 is going for about as much as a GT 1030 but offers way more performance.
Of course, there have always been bargains when shopping for used graphics cards so it wasn't terribly surprising to see that some older models can still hold their own when it comes to performance and pricing. This is particularly good news though because while secondhand shopping is usually reserved for bargain hunters, many more gamers are considering buying used with the way prices are today.
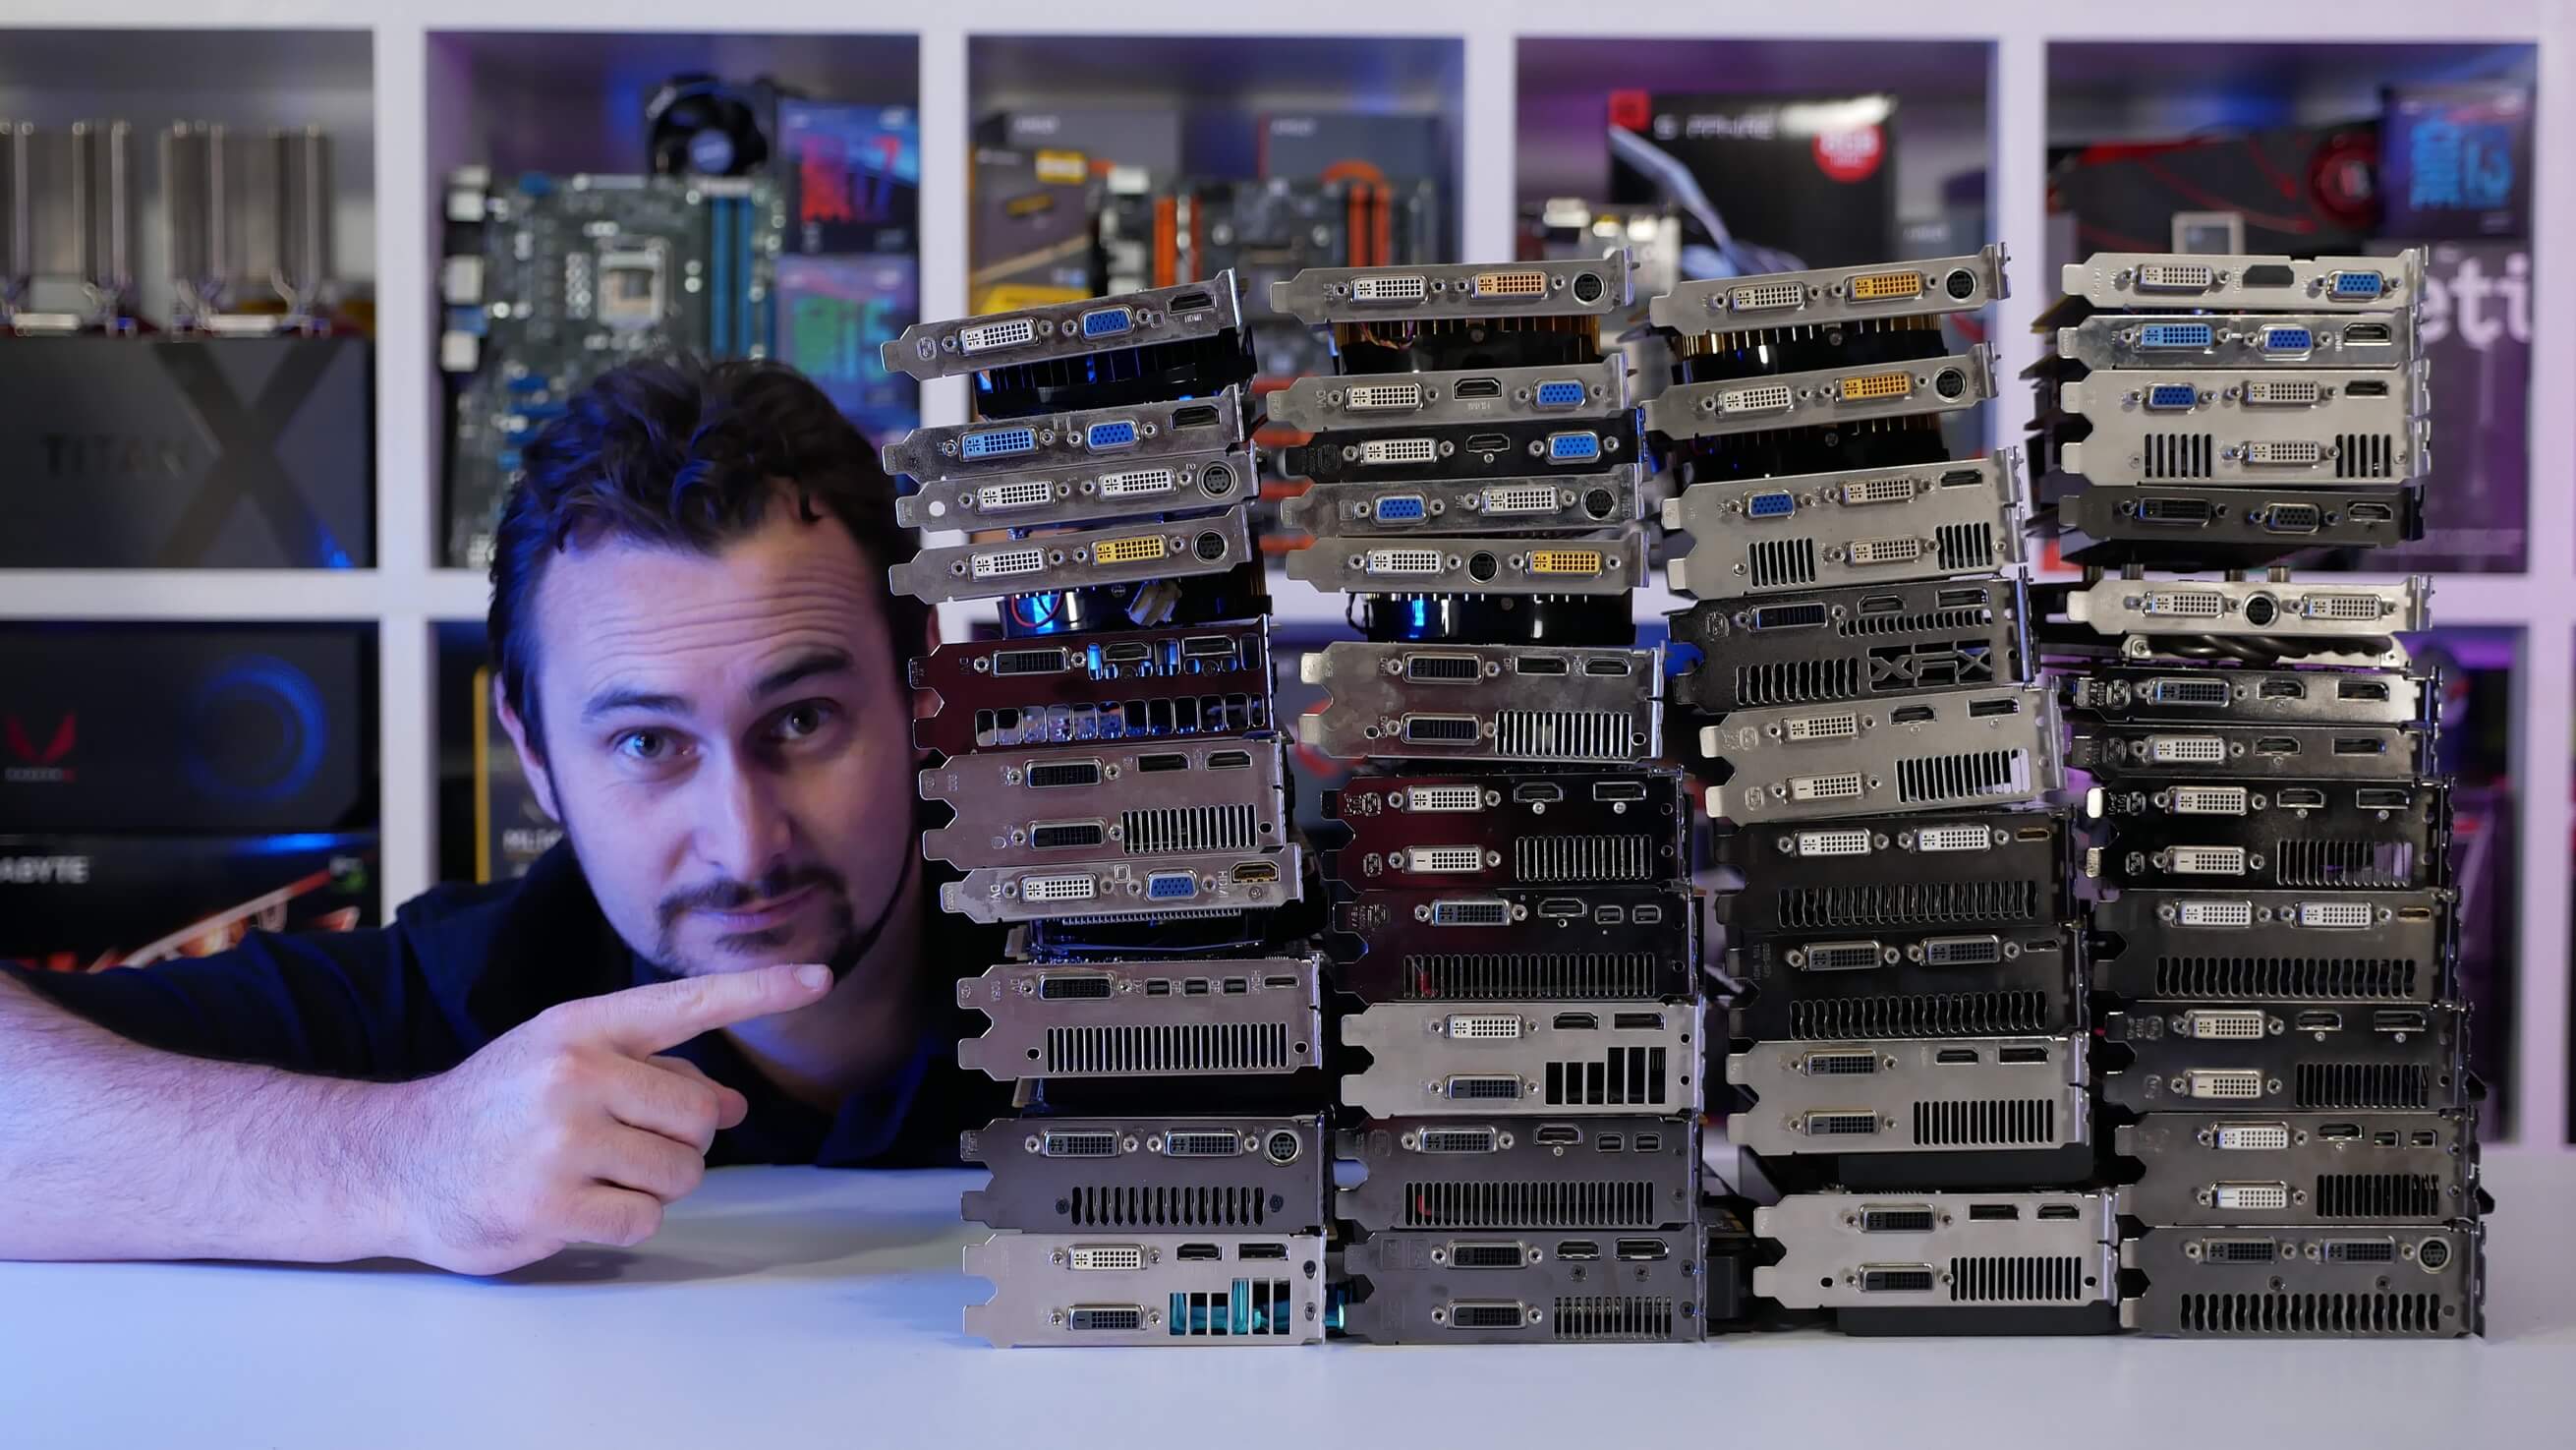
Say hello to Steve!
However, with so many used graphics cards available it's hard to work out where to even begin. Should you figure out which GPU you want first or determine your price range? And how do you know how much you should be paying for a particular model anyway? It's all a bit complicated so to try and simplify the process I've spent a huge amount of time working out the average selling price for each model and then their average performance.
We used eBay's completed listings to determine the average selling price (US sales, all figures are in US dollars) since it wasn't really practical time-wise to do this in more currencies. For the most part though, this information should still translate to other markets.
Pricing is only one piece of the puzzle but is nonetheless the quicker and easier part to work out. It was far more time consuming and difficult to benchmark all 44 graphics cards over three separate games. Our data should help you determine how each card compares in real world games, which I feel is significantly more useful than running synthetic benchmarks, although that would have been quicker and easier.
I wanted to test with games that are fairly neutral, and by that I mean they don't favor one particular brand of GPUs. Therefore, I looked at games where the GTX 1060 and RX 560 along with the GTX 1070 and Vega 56 deliver a similar level of performance. That lead me to Battlefield 1, F1 2017 and Rise of the Tomb Raider, all of which were tested using the DX11 API with the medium quality preset at 1080p.
Frame rates for all graphics cards were higher in Battlefield 1 and F1 2017, while they were about 35% lower in Tomb Raider, so this caused some issues for the lower-end models. I still feel this is a good spread for showing what you can expect from modern games using mild quality settings.
GPU Pricing: September 2017 vs. March 2018
Before we get to the frames per second results, let's talk about the average selling prices for each model.
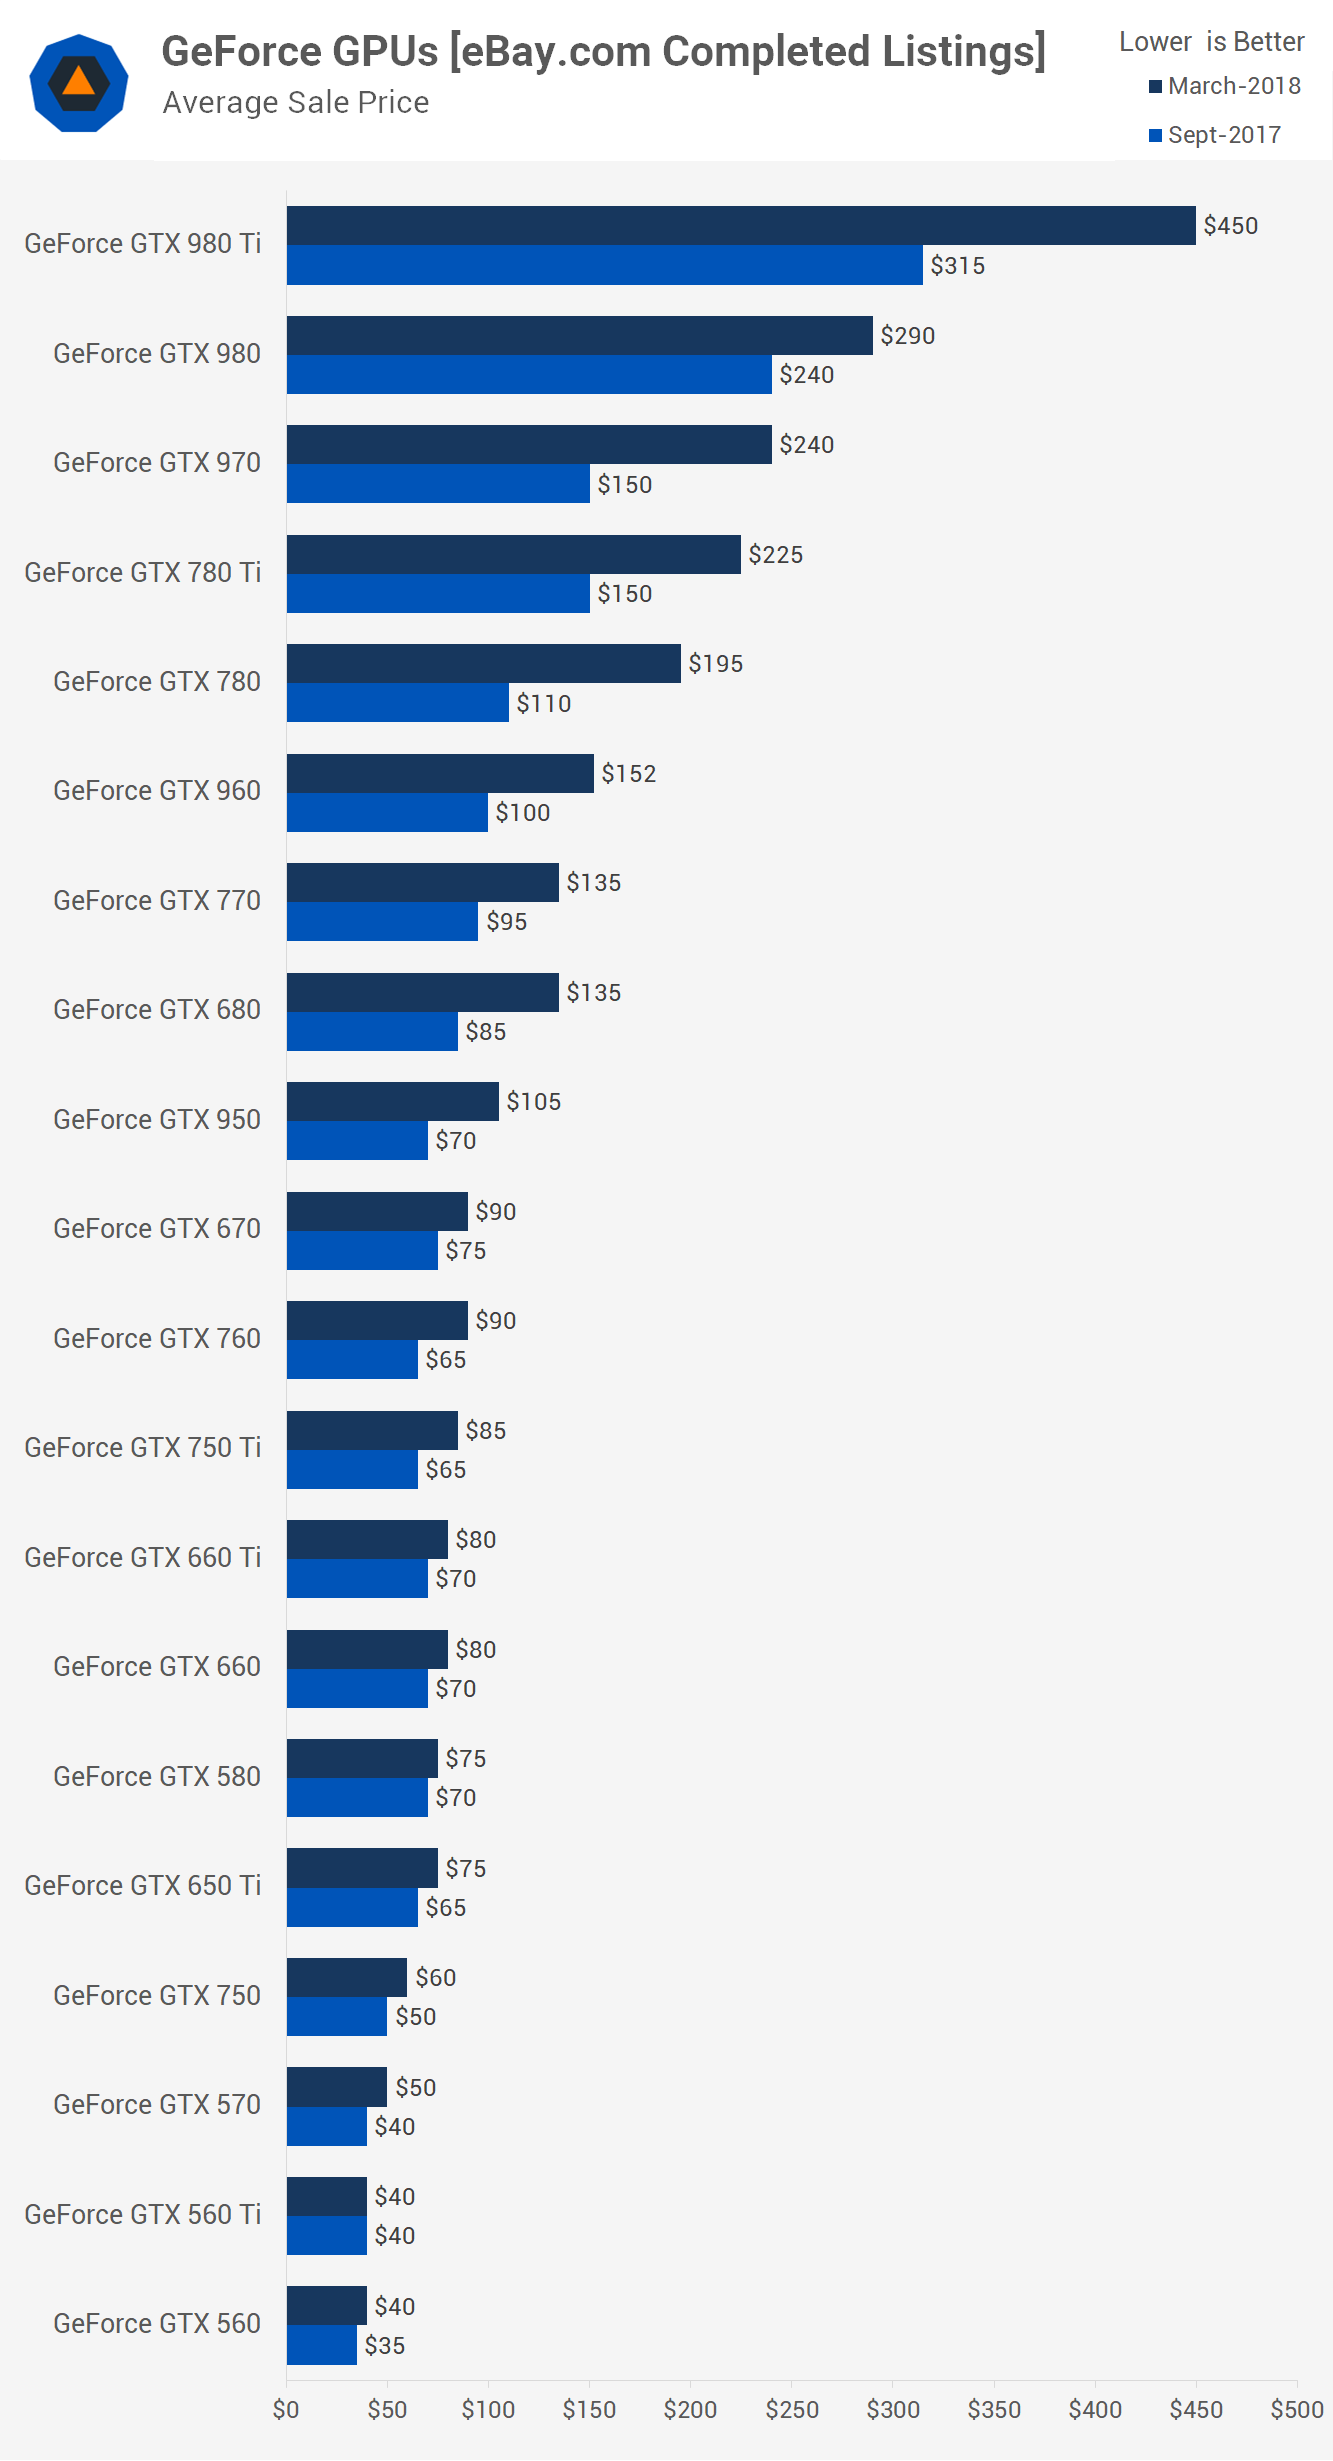
So what you're looking at here is the average sale price on eBay for GeForce graphics cards so far during March and I've included all GeForce 500, 600, 700 and 900 series cards. There are 20 different models here so a wide and varying range of options. Please also note that pricing has been rounded to the nearest $5.
For a bit of context about just how bad graphics card prices have gotten, as if you needed it, we've also included the average selling price information for the September 2017 period. As you can see, graphics cards such as the GTX 970 have increased by almost 70%. Of course it's the newer more capable models that have suffered the highest price inflation but even so were seeing about a 15% increase for older mid-range models as well and pricing already started to increase by September.
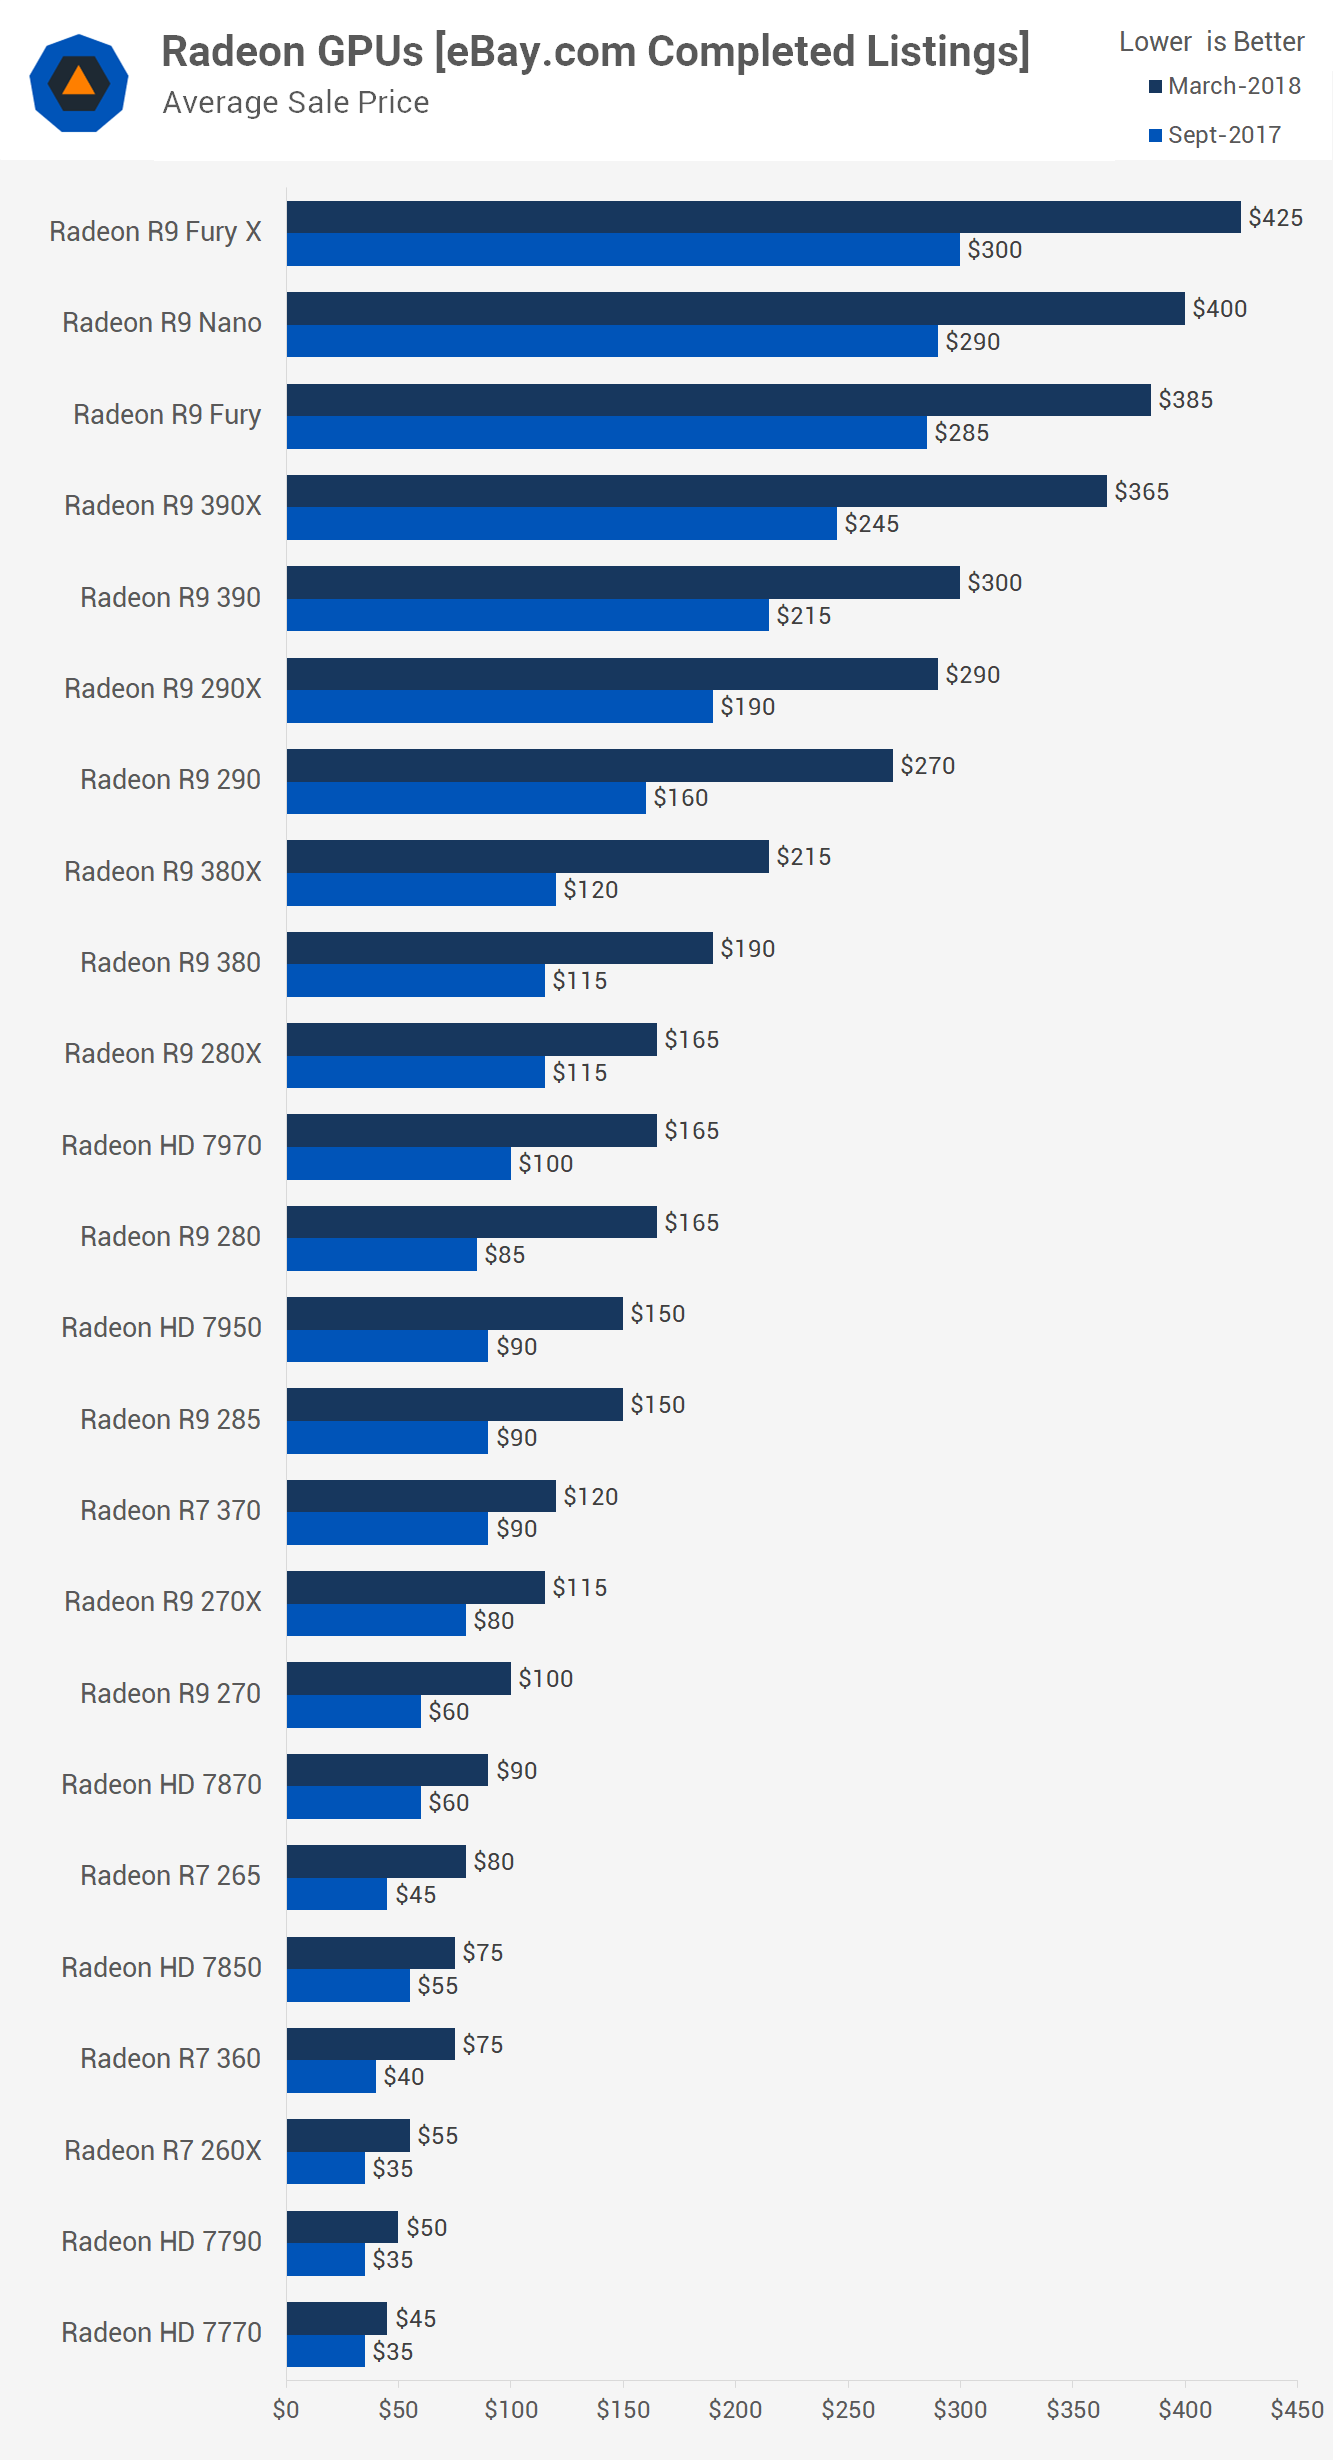
Moving over to the Radeon GPUs we have 24 models but please note I haven't created separate listings for factory overclocked options like the 7970 GHz Edition or 7950 Boost and instead they were included with the standard models.
Again, looking back at pricing in September of 2017 you can see the AMD graphics cards have increased in demand significantly with most models having increased by 60% or more in price over the past six months. It's shocking to see ultra entry level models such as the R7 360 increasing by almost 90% in value. Pretty insane really but even with all this pricing info sorted out, you should have a rough idea of what each model is worth, but you probably still have little idea about which one you should actually buy.
Performance
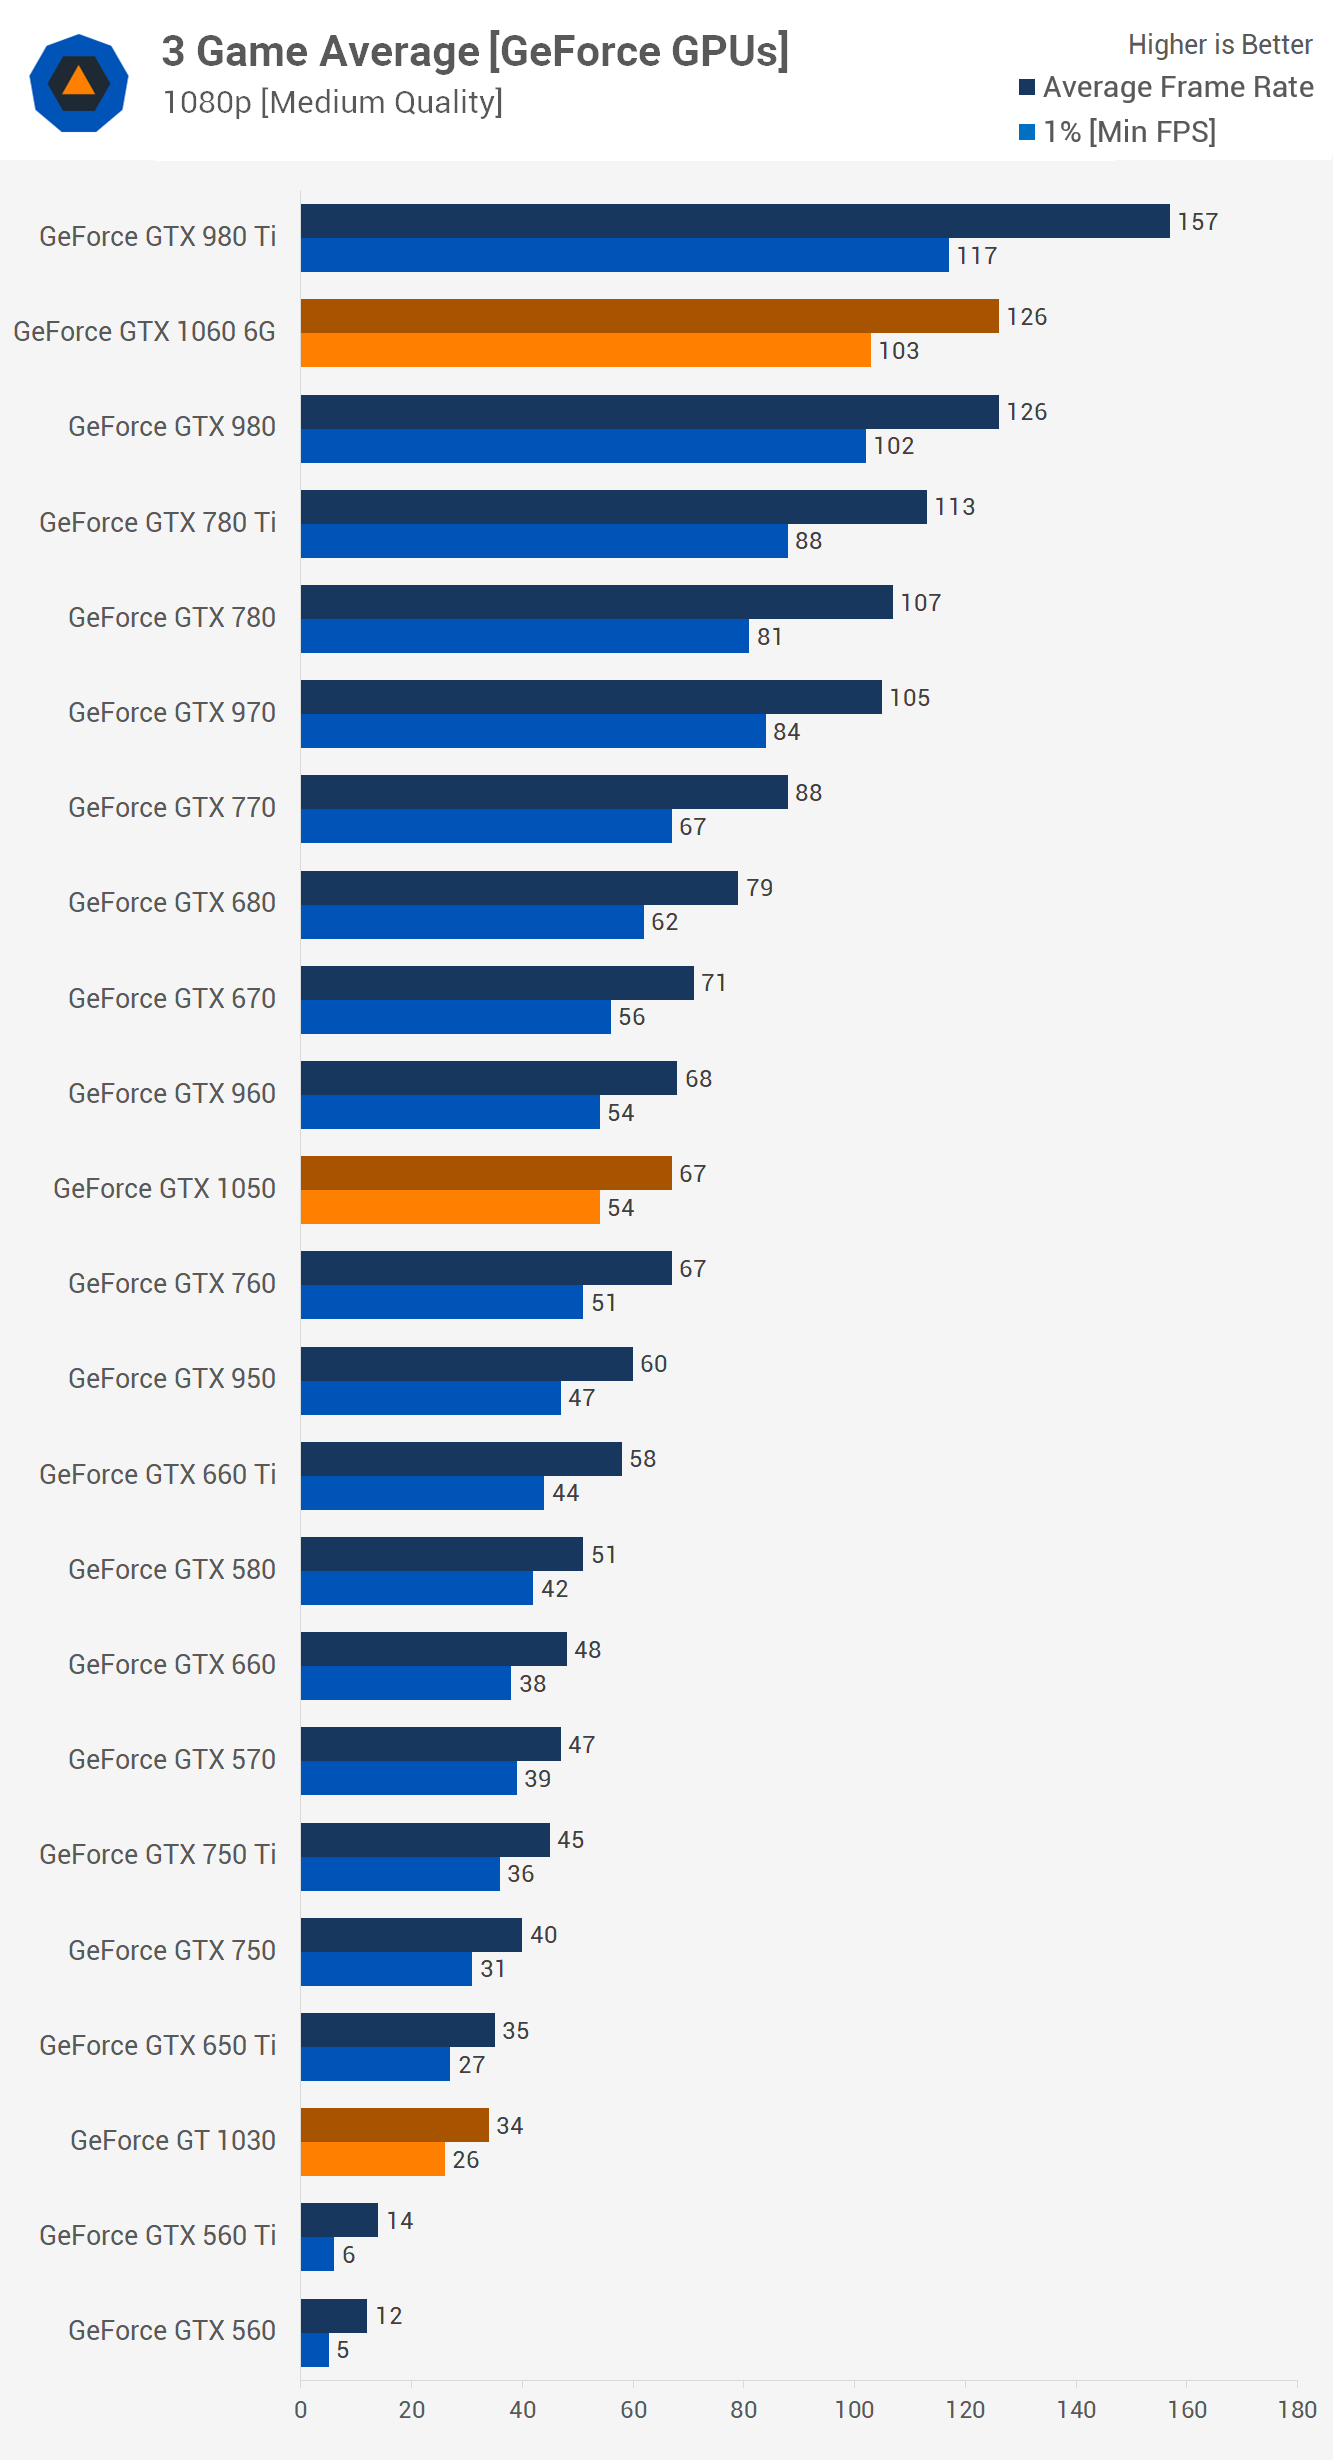
So then, let's talk performance. Here's how the GeForce GPUs stacked up when benchmarked in the three modern games using medium quality settings at 1080p. Also please note that I've included the GT 1030, GTX 1050 and GTX 1060 6G so you can see how these older models stack up next to modern entry-level and mid-range offerings.
As you can see, the GTX 980 is comparable to the GTX 1060 6G, the GTX 960 and 760 are comparable to the GTX 1050 while the GTX 650 Ti is comparable to the GT 1030.
For those wondering, I'm using the 384 CUDA core version of the GTX 560 Ti and for whatever reason it stinks – it's way worse than the GTX 570 and I tried two different models and got the same results. So, frankly, if I were shopping for a used card, I'd scrub the base model GTX 560 Ti and GTX 560 off my list.
Most of these graphics cards provided playable performance but be aware models with less than 2GB of VRAM can and will deliver mixed results in modern titles.
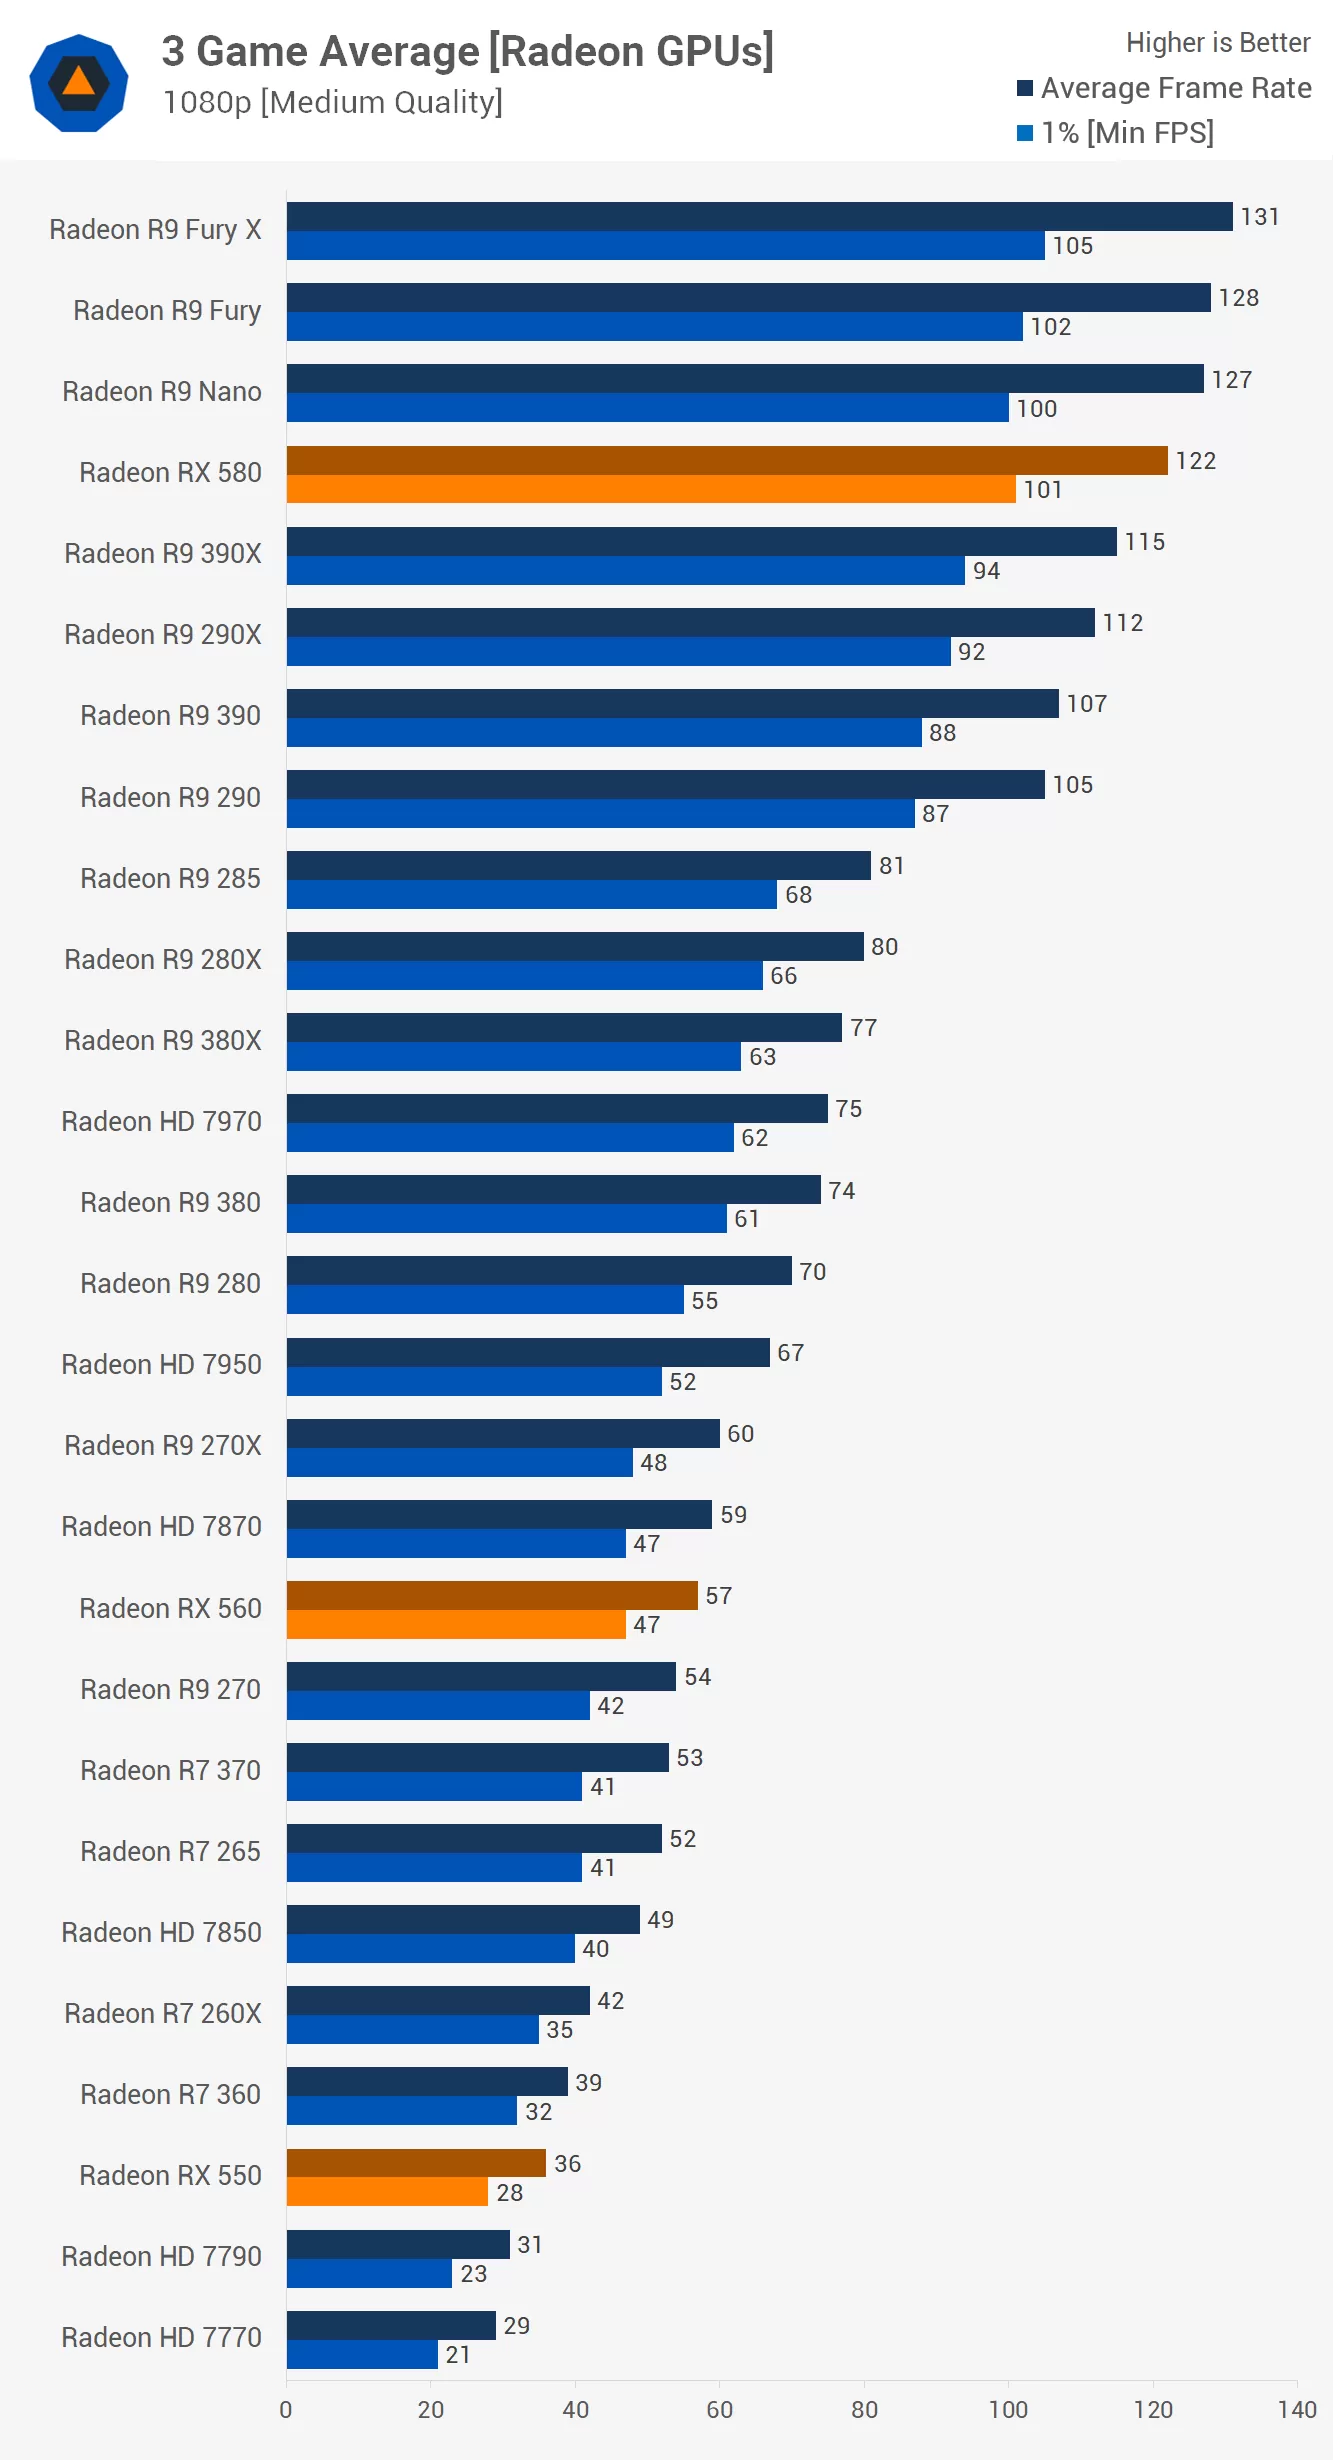
Moving on to the Radeon GPUs we see fairly respectable performance across the board with the exception of the Radeon HD 7770 and 7790. The R7 360 was also a bit of a battler and the R7 260X will struggle in some titles, requiring lower quality settings and perhaps even a lower resolution.
Here we can see that the RX 580 sits between the R9 390X and R9 Nano while the RX 560 is comparable to the HD 7870 and R9 270X. Then the RX 550 can be found sitting between the HD 7790 and R7 360.

Copyright 2022 © coruscomusic.com 泰山压卵网 All Rights Reserved